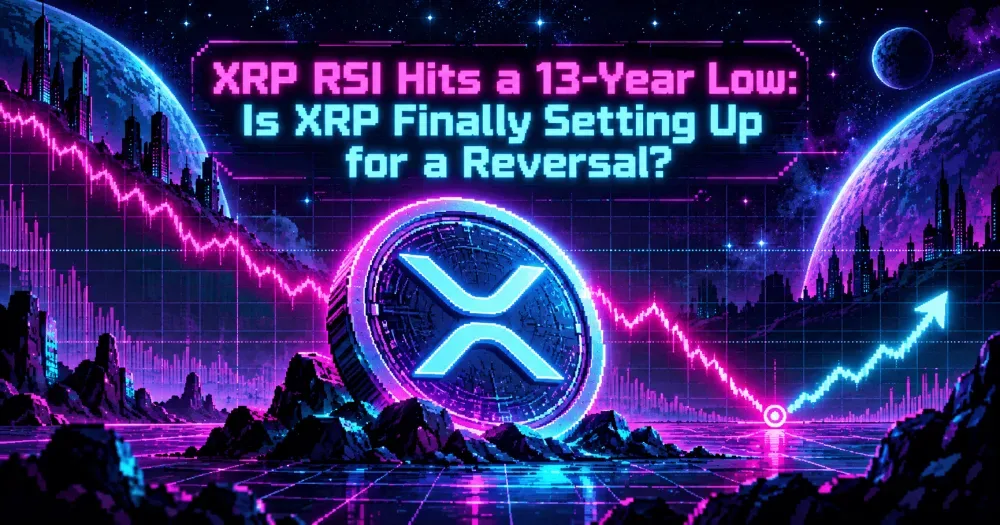
XRP has just reached an extreme that has never appeared in the token’s 13-year trading history. XRP’s two-week Relative Strength Index (RSI) has fallen to roughly 33.5: below the lows recorded during the 2018 bear market, the 2020 COVID crash, and the 2022 crypto winter.
The question now is whether the record-low XRP RSI represents seller exhaustion or merely confirms that the downtrend remains powerful.
Related: XRP Defies $1.38 Billion Ripple Unlock as Institutional Demand Rewrites the Market
Why Has the XRP RSI Fallen to a 13-Year Low?
The widely discussed record refers specifically to XRP’s two-week RSI, not its daily RSI.
Relative Strength Index measures the speed and magnitude of recent price changes on a scale from 0 to 100. Traders commonly interpret readings below 30 as oversold and readings above 70 as overbought, although those thresholds depend heavily on the timeframe and market.
Analyst Cryptollica highlighted that XRP’s two-week RSI has dropped to approximately 33.5.
That is not technically below the conventional 30-point oversold threshold. What makes it exceptional is the historical comparison.
The recent XRP RSI is lower than it was during:
- XRP’s 2018 bear market;
- the March 2020 COVID crash;
- the 2022 crypto collapse;
- every other major XRP correction in its trading history.
In other words, momentum on this particular long-term timeframe has never been weaker.
The reading appeared after another sharp XRP selloff. The token fell from roughly $1.42 before the failed Senate CLARITY Act vote to around $1.27–$1.30 afterward, extending a much larger decline from previous cycle highs. That pushed an already weak momentum indicator into completely new territory.
As of September 18, XRP RSI has already rebounded to roughly 43.78, while the token trades around $1.33.
Does a Record-Low XRP RSI Mean XRP Is Oversold?
Not automatically. This is one of the easiest mistakes to make when interpreting RSI.
An extremely low reading does not mean an asset has become “too cheap” and therefore must rise. RSI measures momentum, not fundamental value.
A cryptocurrency can remain oversold for a long time while continuing to fall. Strong downtrends regularly produce low RSI readings precisely because sellers remain in control.
The unusual XRP RSI nevertheless matters because it shows how far momentum has already deteriorated.
At some point, a downtrend runs out of increasingly aggressive sellers. If most traders willing to sell have already done so, even a modest increase in demand can produce a powerful rebound.
That is why extreme RSI readings often appear around market bottoms.
The problem is timing.
An extreme reading can identify a potential bottoming process without identifying the exact bottom.
XRP Is Testing a Long-Term Rising Channel
The strongest bullish argument is not the XRP RSI alone. XRP is also trading near the lower boundary of a long-term rising channel that has contained its price across multiple market cycles.
Cryptollica’s chart shows price approaching this structural support at roughly the same time that two-week momentum reaches its weakest historical level.
Those two signals reinforce each other.
If XRP were printing a record-low RSI while simultaneously breaking every major long-term support, the indicator would be much less encouraging. Instead, sellers have pushed momentum to an unprecedented extreme without yet decisively destroying the larger rising structure.
Another analyst, EGRAG Crypto, has highlighted a similar pattern on XRP’s two-month RSI.
His argument is not that one precise RSI number predicts the bottom. Rather, XRP has entered a longer-term momentum zone that previously appeared during major bottoming processes before subsequent expansions.
That still leaves plenty of room for volatility. A bottoming zone is not the same thing as an immediate rally.
The $1.29 Area Is Now Critical
The shorter-term chart is less reassuring.
Technical analyst ChartNerd has identified the 20-week EMA around $1.29 as a crucial support area. XRP has recently been trading around that level while remaining below the 50-week EMA near $1.52.
That leaves XRP compressed between two important moving averages. The bullish scenario is straightforward.
If XRP can defend the lower area, recover from the record-low XRP RSI, and eventually reclaim approximately $1.52, the current decline would increasingly resemble a long-term washout followed by accumulation.
The bearish scenario is equally clear. A convincing weekly breakdown below the 20-week EMA would weaken the bottom thesis and bring the psychological $1.00 level back into focus.
That is why the next price move matters more than the RSI reading itself. Momentum is stretched. Price still has to confirm that buyers are taking control.
Read More: Stablecoin KYC Rules Should Not Cover P2P Transfers, Blockchain Association Warns
XRP ETF Demand Is Moving in the Opposite Direction
One of the more interesting parts of the current setup is that XRP’s market price and institutional fund flows are telling different stories.
U.S. spot XRP ETFs have accumulated roughly $1.7 billion in cumulative net inflows since launching in late 2025.
Demand has also continued during recent price weakness.
On September 16, XRP ETFs recorded another approximately $3.5 million in net inflows even as Bitcoin and Ethereum ETFs suffered hundreds of millions of dollars in combined outflows. Franklin Templeton’s XRPZ accounted for that day’s XRP inflow.
This does not guarantee a reversal. But the divergence is notable: the XRP RSI is signaling historically weak momentum at the same time that regulated investment products continue attracting capital.
That is a very different environment from a collapse in which both price and investor demand are disappearing simultaneously.
XRP Ledger Fundamentals Have Also Improved
The price weakness is also occurring while activity on XRP Ledger changes underneath it.
Second-quarter data showed that the number of daily order-book traders declined significantly year over year, but the remaining accounts were trading much larger amounts. Order-book volume increased approximately 79%, while the value held in tokenized assets and RLUSD climbed above $4 billion.
Ripple has also continued expanding institutional infrastructure around payments, custody, tokenization, stablecoins, and prime brokerage.
None of this forces XRP higher. Ripple’s business growth and XRP’s token price are related only indirectly, and strong network fundamentals can coexist with a falling market for months.
Still, the contrast matters when evaluating whether the record-low XRP RSI reflects a deteriorating ecosystem or primarily a severe market correction. So far, the evidence points more strongly toward the latter.
Read More: Stablecoin KYC Rules Should Not Cover P2P Transfers, Blockchain Association Warns
A low RSI is a setup. A reversal needs price confirmation.
The first sign would be XRP consistently defending the $1.25–$1.30 region rather than merely bouncing from it temporarily.
The next would be a sequence of higher lows. That would show that buyers are entering at progressively higher prices instead of allowing sellers to create another leg downward.
More importantly, XRP would need to reclaim major resistance. The 50-week EMA around $1.52 is particularly important because repeated failures around that area have kept the larger intermediate trend under pressure.
A sustained break above it would make the record-low XRP RSI considerably more meaningful. Until then, XRP remains a market with historically stretched momentum but no confirmed trend reversal.
Yes. RSI extremes do not eliminate downside risk.
If XRP loses the $1.25–$1.29 support region decisively, $1.00 becomes the obvious psychological target. A move toward that level could push momentum even deeper into historically unusual territory.
That would not necessarily invalidate the longer-term channel immediately, but it would delay the reversal thesis.
There is also a broader market problem.
Crypto remains sensitive to macroeconomic risk, interest rates, liquidity, Bitcoin direction, and regulatory developments. Even an attractive XRP-specific technical setup can fail if the entire digital-asset market enters another aggressive risk-off phase.
The failed CLARITY Act vote already demonstrated how quickly regulatory news can overwhelm technical positioning.
The XRP RSI should therefore be treated as evidence of an extreme, not a guarantee that the extreme is finished.
The conditions are becoming more interesting.
XRP’s two-week RSI has reached its lowest level in 13 years. Price remains close to a long-term structural support area. U.S. XRP ETFs continue attracting capital despite weakness in the underlying token. XRP Ledger infrastructure and institutional usage have also continued developing.
That combination creates a credible reversal setup, but not yet a confirmed reversal. For that, XRP needs to stop producing lower lows, defend the current support region, and eventually reclaim resistance around $1.50–$1.52.
If those things happen while the XRP RSI begins rising from its historic low, the current period could eventually look like a major cycle bottom.
If support fails, the same record-low RSI will simply have been warning traders how strong the bearish momentum really was.
For now, XRP has reached an extreme. The market still has to prove that the extreme is over.
FAQ
What is the XRP RSI right now?
The widely discussed long-term signal is XRP’s two-week RSI, which recently fell to approximately 33.5 — its lowest level in the token’s roughly 13-year trading history.
Is XRP oversold?
XRP’s two-week RSI is historically extremely weak, although a reading around 33.5 remains slightly above the conventional RSI oversold threshold of 30. The significance comes primarily from comparison with XRP’s own historical cycles.
Does a low XRP RSI mean the price will rise?
No. Low RSI indicates weak momentum and can occur during prolonged downtrends. A reversal requires additional confirmation from price action, support levels, volume, and broader market conditions.
What XRP price levels matter most now?
The $1.25–$1.30 region is an important support zone, while the 50-week EMA near $1.52 represents significant resistance. Losing current support could put the $1.00 psychological level back in focus.
Could the XRP RSI signal a major bottom?
It could be part of a bottoming process. Similar long-term momentum extremes have appeared near important XRP lows in previous cycles, but historical patterns do not guarantee that the current price has already reached its final bottom.